You don’t pick charts.
You pick variables.
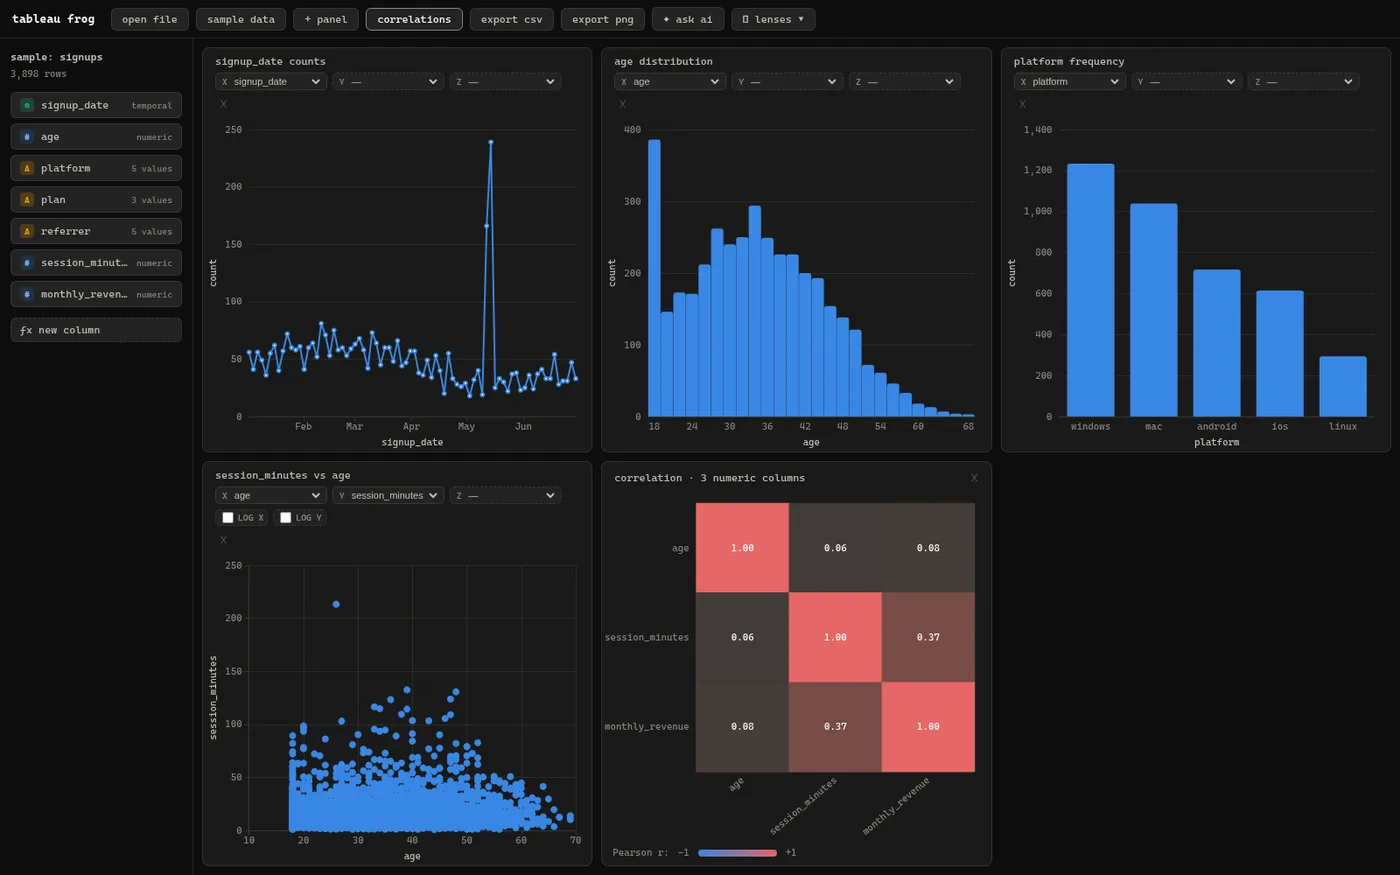
tableau-frog is a data explorer for people who’d rather type than click. Assign columns to x / y / z slots and the chart is inferred. Brush any panel and one global lens recolours every other panel by statistical contrast — over-represented in red, under in blue, and every colour is significance-tested.
This isn’t a video. Drag a box.
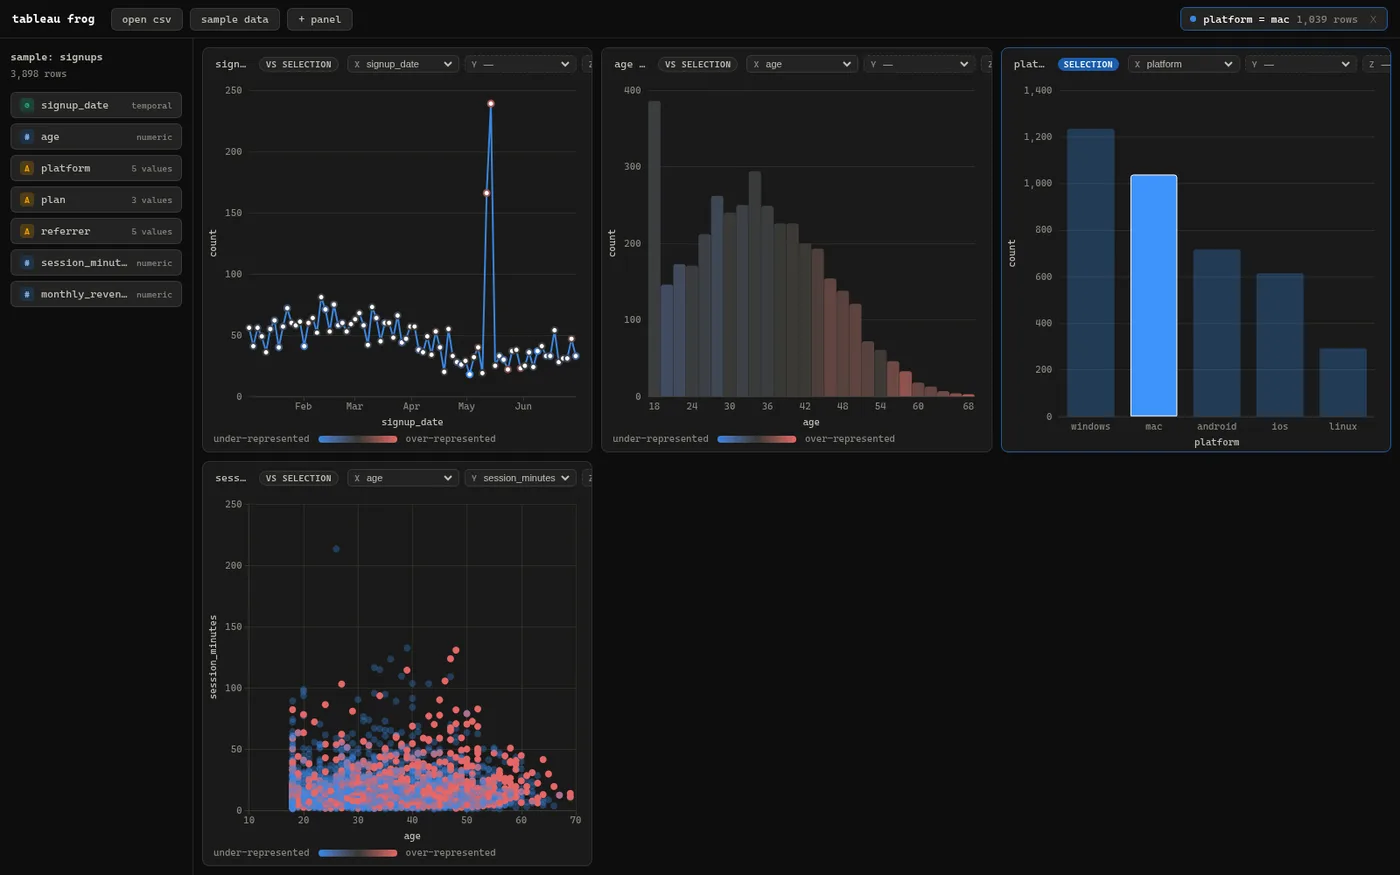
2,000 synthetic signups with a cohort hiding in them. The scatter is the source panel — brush a region and the responder panels recolour by real log-ratio prevalence, each group two-proportion z-tested with a Benjamini-Hochberg correction. Try the dense high-session cloud.
Colours you can trust.
Every contrast is significance-tested.
The source panel keeps population colours with an accent ring; every responder colours its groups by prevalence log-ratio, clamped to ±ln 4 so a 2× lift reads half-saturated. Switch a panel to significantmode and groups whose enrichment isn’t statistically real fade to neutral gray. Shift-brush composes; the chip pops the newest clause; Esc clears.
Nine things, no chart picker.
Inferred charts
Assign columns to x / y / z and inferChartKind derives the family from the axis type signature — scatter, clusters, line, histogram, bar, distribution, crosstab. You never open a chart-type menu.
One global lens
Brush, click a bar, drag a lineX, click a crosstab cell — it all becomes one Selection. Shift composes with AND; the chip pops the newest clause; Esc clears all.
Significance-aware contrast
Per-panel ratio vs significant metric. The latter greys out any group whose enrichment isn't statistically real — two-proportion z-test against the complement, then Benjamini-Hochberg FDR.
Missing values, first-class
The sidebar shows ∅ counts; bar / crosstab / distribution render a selectable (missing) bucket; a missing selection makes null-ness itself a lens.
Command palette⌘⇧P
A fuzzy, validity-gated command list makes the app fully keyboard-drivable. Quick open (Ctrl+P) is a noun-first jump to a column, saved lens, or dataset — a leading > delegates to commands.
Derived columnsƒx
An eval-free expression engine: a hand-written tokenizer feeds a Pratt parser to a typed AST that compiles to a single linear pass over the columnar arrays — a 1M-row derive stays one scan.
Saved lenses
Name a selection, stash it per dataset, re-apply later — validated against the current schema, installed as a global lens so every panel renders it as contrast.
Correlation overview
A pairwise-complete Pearson-r heatmap over the numeric columns on a diverging visualMap pinned to r ∈ [-1, 1]; click a cell to spawn that scatter.
Plugin API + scripting
registerChartPlugin claims axis-type signatures ahead of built-in inference; everything is on window.tableauFrog for console-driven automation.
Point at something odd. Get falsifiable cards.
Investigate is the bidirectional counterpart to the assistant: brush a notable subset, and the model returns 2–4 hypotheses — each with concrete, one-click test projections and a stated expectation, grounded strictly in significance-aware contrast stats. Apply, then mark each confirmed or rejected. The verdict trail persists.
Brush → generate hypotheses
A brushed cohort becomes the lens. Hit Ctrl+I and cards appear in a side drawer, ranked by confidence and carrying the contrast that motivated them.
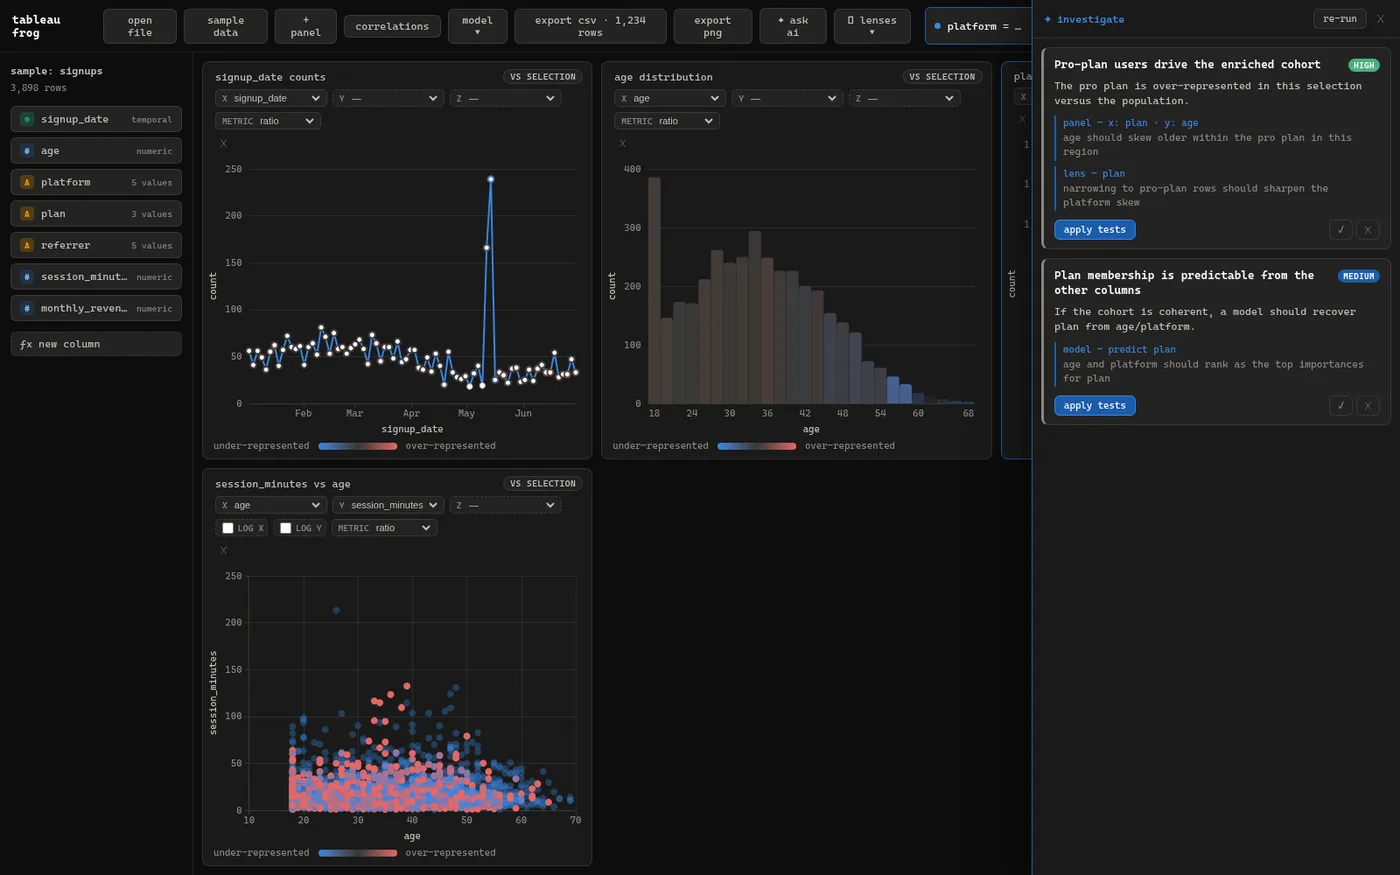
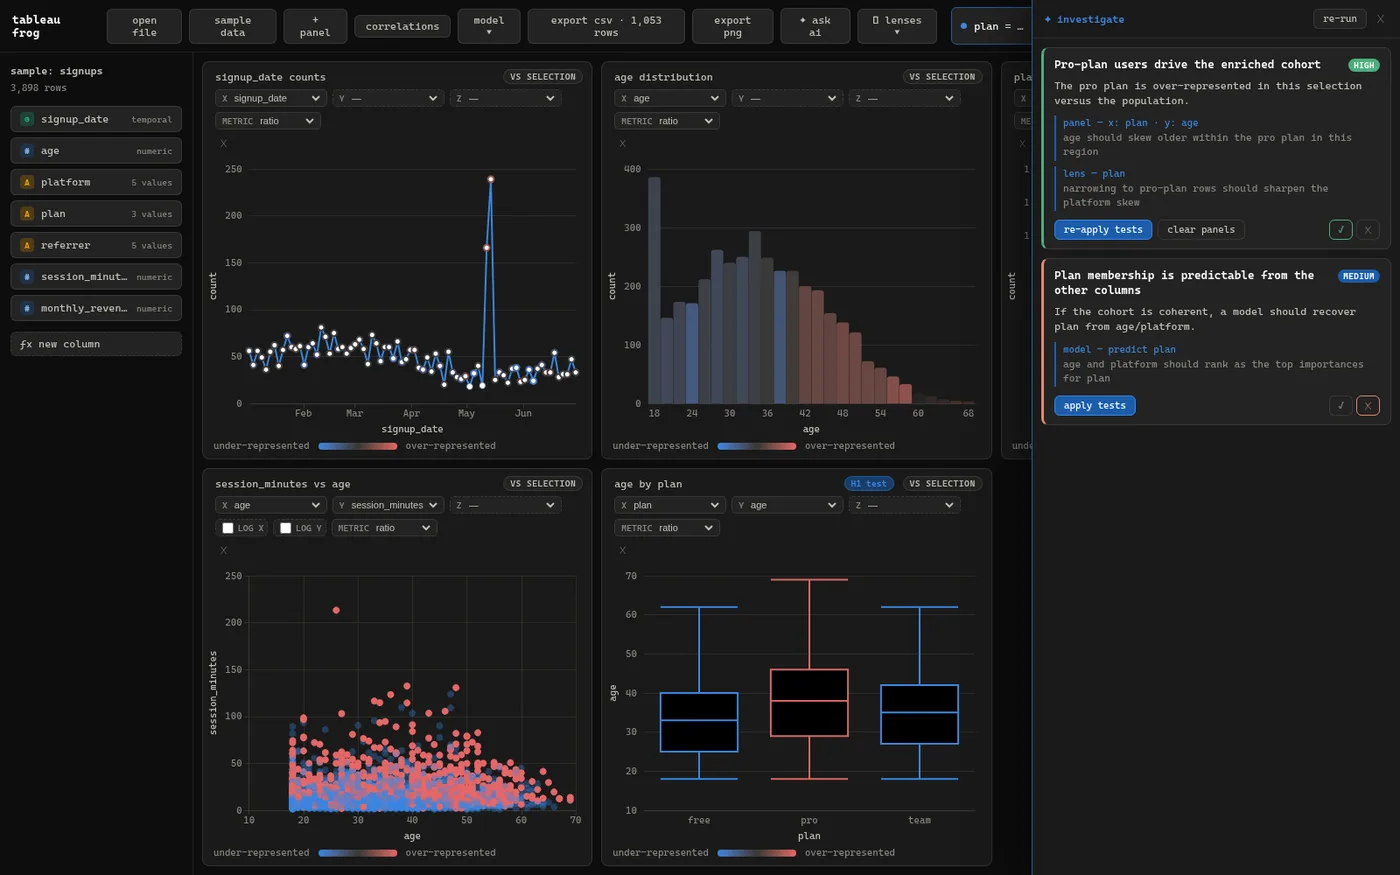
Apply the tests → confirm or reject
Each test spawns real panels tagged H1 test, edits the lens, or trains a model — applied in dependency order. The card’s border colours with your verdict; the trail is saved per dataset.
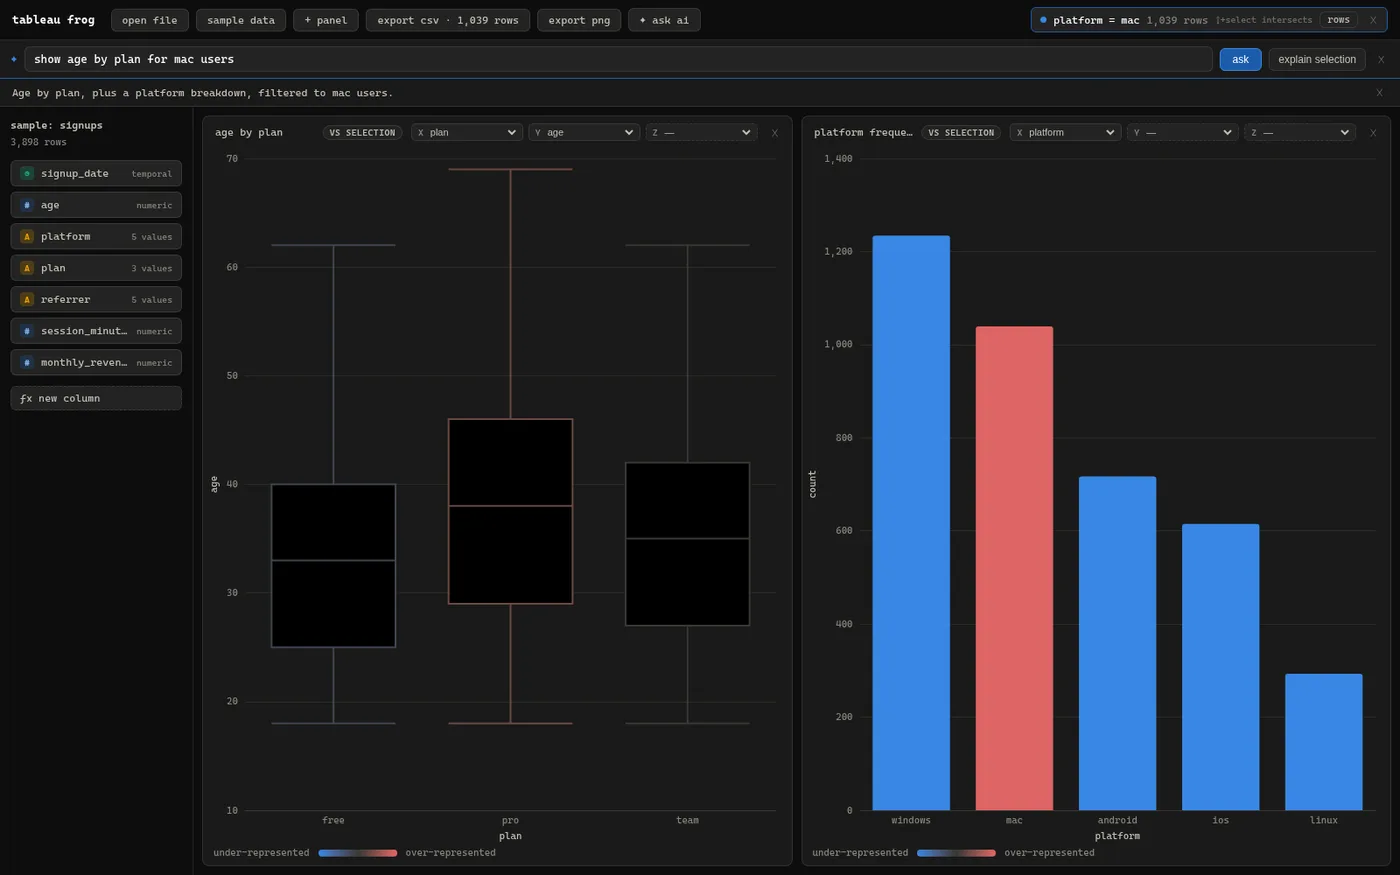
Natural language, grounded in the real stats.
The assistant summarises your dataset to shape only — types, ranges, capped category counts, row count; never a row of data leaves— then returns a validated plan of panels, a composed lens, and derived columns. “Explain selection” answers from the actual contrast summaries, not a hallucinated story.
A random forest that trains in your browser.
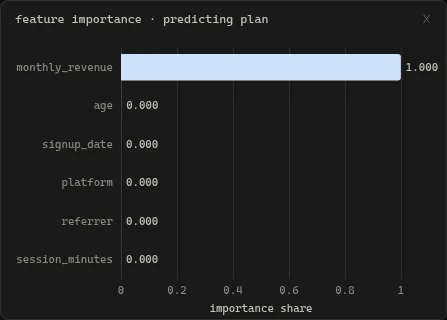
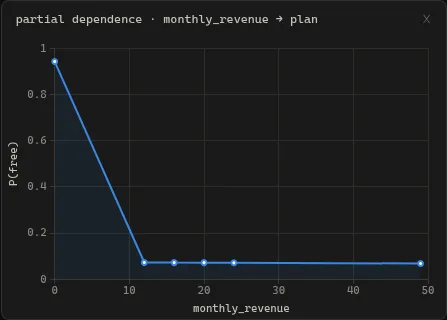
model: predict <column> grows a from-scratch, deterministic random forest over the columnar arrays — histogram-binned splits, seeded mulberry32 for reproducibility — then explains it with permutation importance and Friedman partial-dependence curves. 36k rows in ≈0.4 s. No data leaves the tab.
Hack it.
Everything is exposed at runtime on window.tableauFrog. Claim an axis-type signature with a chart plugin, or just drive the live app from the console.
// claim a new axis-type signature with a chart plugin
window.tableauFrog.registerChartPlugin({
  kind: "hexbin",
  matches: ({ x, y }) => x?.type === "numeric" && y?.type === "numeric",
  create: (dataset, axes) => new HexbinChart(dataset, axes),
  buildOption: (model) => ({ series: [{ type: "custom", /* … */ }] }),
});

// …or just script the live app from the console
const frog = window.tableauFrog;
frog.addPanel({ x: "age", y: "session_minutes" });
frog.setLens({ field: "plan", eq: "pro" });
frog.deriveColumn("ltv", "monthly_revenue * tenure_months");log(price)natural log · numeric/temporalzscore(age)standardise against the columnyear(signup_date)temporal → numeric partbucket(revenue, 10)quantise into N bucketsclamp(x, 0, 1)min/max fencecontains(name, "pro")string predicate → booleanNo superlatives. Just measurements.
Clone it. Run it.
A Tauri v2 desktop app that runs identically in a plain browser. Pure-TypeScript domain, ECharts on the SVG renderer, Rust only for the native file dialog.
# variables-first, keyboard-first, AI-native
git clone git@github.com:you/tableau-frog.git
cd tableau-frog

bun install
bun run dev            # http://localhost:1420
bun run tauri dev      # native desktop shell